Top Financial Industry Performers Win with Intelligence
The onslaught of fintech on traditional financial institutions (FIs) continues at a dizzying rate. In Q1 of 2017 alone, $2.7B was invested in 226 deals. Those fintech firms creating significant disruption in the financial sector have built their businesses from the end-user’s perspective rather than a product perspective. This gives them a distinct competitive advantage.
Recently, “financial thought leaders” reached full agreement that traditional banks and credit unions MUST ad0pt customer centricity, branding and data analytic methods and processes.
But the big question remains unanswered, or at best, poorly answered. That BIG question: IS there a measurable advantage gained from customer, brand and data analytics?
CEO’s today often frame this question something like the following:
“I’m increasingly spending more and more money on customer, brand, data and analytics capabilities, whether that’s in marketing or other areas. Am I going to get a real return out of this that provides me a measurable competitive advantage through that investment?”
In other words, does today’s frenzied focus on customer centricity, brand and data analytics have any correlation to real-world financials for TRADITIONAL financial institutions?
Click Here to Download White Paper “Growth by Merger”
We already know the answer to this is a resounding YES for fintech financial organizations. They start out with customer centricity, branding and data analytics as the key foundation blocks to their entire business model. These factors are, and have been, critical to gaining and advancing a foothold in the financial industry landscape.
But this question still remains for traditional FIs.
First: Understand where Net Promoter Score (NPS) fits in today’s world
Credit unions love to sling NPS ratings around cavalierly as proof they are nailing the primary CU objective of meeting member needs. And CU’s do have twice as high NPS ratings as banks on average.
NPS correlation to growth is typically “derived” in credit union case studies through comparison of NPS increases to % year-over-year asset increases. For the majority of credit unions, asset growth over the past couple of years has been good. So this makes a great feel-good story to tell.
But is this a good picture of reality?
Consider JP Morgan Chase. This largest US bank grew a modest 3.88% year-to-year in asset size when last measured. That does not sound impressive at all compared to the 10.2% asset growth of Navy Federal Credit Union during the same time period.
Now, consider the hard numbers. JP Morgan Chase’s growth in hard dollars was approximately $77B. Roughly the same as Navy Federal Credit Union is in total asset size. So, last year Chase grew in asset size and comparable customer count, the equivalent of a Navy Federal Credit Union.
Generally speaking, the top ten banks in the US have grown at multiples the rate of CUs since the great recession in 2008 – in real dollars and customer counts. Today, these behemoths’ hold nearly $12 trillion in assets.
This despite the fact their NPS ratings range from -15 to +18 compared to a CU industry average of approximately +38.
NPS is still a meaningful metric to understand how well YOU are delivering to your CORE market audience. And for that fact alone, it remains relevant as a benchmark against which to determine impact of your future service, brand or product implementations.
But again, only against your core market audience and against YOUR past benchmarks. NPS is meaningless in understanding why the big are getting bigger and why fintech continues to encroach on the entire industry.
Obviously, more must be taken into account in today’s world to understand what drives growth for financial services!
So, what metrics help us understand this seeming dichotomy? And how do credit unions compare on these metrics?
Second: Metric and Method Overview
Let’s quickly walk through two important frameworks to answer this question.
These frameworks were introduced over 10 years ago through academic research. We at Burshek Research created an implementation approach which makes them actionable.
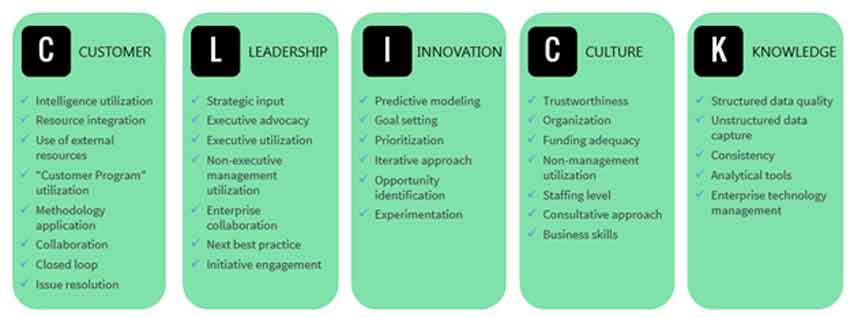
These two frameworks are called the 5 Stages of Customer Intelligence Maturity and the CLICK model, standing for Customer, Leadership, Innovation, Culture and Knowledge. These are what we use at Burshek Consulting to benchmark firms in terms of their customer intelligence maturity.
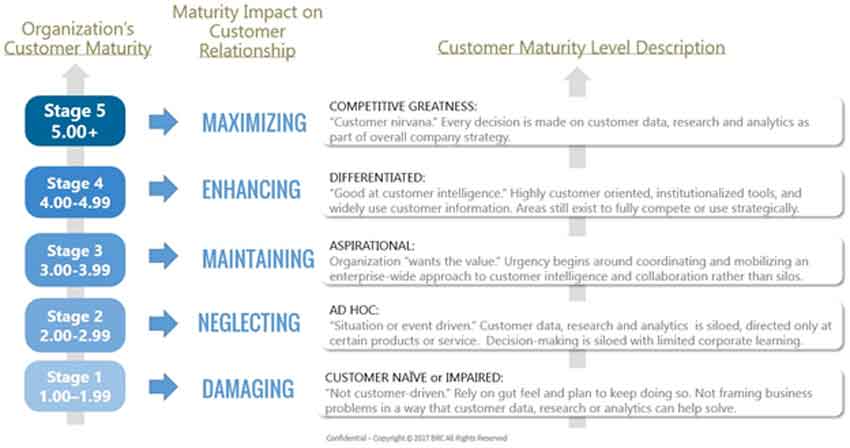
Starting with the easy to understand 5 Stages of Customer Intelligence Maturity. It is very simple. It is a 1 to 5 scale. A company moving up the vertical axis progresses from a Stage 1 to a Stage 5 organization. Each stage indicates a different internal level of maturity and a differing market impact on customer relationships.
Ideally, an organization moves up from a beginner’s level, called Customer Naïve or Impaired. At stage 1 there is very little customer and brand consistency, data quality, siloed information (if at all), and very little intentionality when it comes to using data to drive unique insights.
As an organization moves up through stages 2 and 3 you start to see more intentionality, we call it Ad Hoc at stage 2 and Aspirational at stage 3. You will see in the data we share with you shortly that financial service organizations typically reside in and around these stages.
You really gain momentum moving up into stages 4 and 5. Stage 4 being what we call a truly Differentiated Company. Often there is a dedicated customer, brand and analytics team. Yet all are working across the Enterprise, no longer in silos. This results in an intentional customer insights and engagement approach enterprise wide.
And then the ultimate is what we call stage 5 of Competitive Greatness. This is where every decision made inside the enterprise is driven in some fashion by customer, brand or other data and analytics.
The second framework we use is essentially ‘what we are measuring.’ It is called the CLICK framework. As mentioned earlier, very simply this stands for Customer, Leadership, Innovation, Culture, and Knowledge.
In simple terms, the ones that stand out to us from our research are usually first, the K. And the K of Knowledge includes both customer and brand data breadth and quality, but it also includes the technologies driving that breadth and quality.
The other one we tend to focus on is Leadership, the L. We talk to a lot of professionals and teams who say ‘I just don’t feel like we have leaders that are walking the talk around here.’
And finally, the middle C of CLICK is Culture. This is the internal people side. We get many questions ‘should I invest in more people or invest in more technology?’ and our sense from the research is, both. In the long term, having people who have the qualitative and quantitative methodological skills plus the technological skills, that combination is going to win the day.
Notice the first C, Customer, is not one of the factors we find as relevant to how an organization is competing. Despite the fact, much of this activity results in outputs such as Overall Satisfaction scores and NPS ratings.
This is because, many times, larger organizations are doing alot in terms of customer feedback and information gathering. Yet, there is little to no impact on the organization’s strategy or actions.
Without excellence in Knowledge structure, Leadership usage and advocacy and Cultural receptivity and clarity to act on information – doing the right things with the Customer fall short of the impact it could or should.
I share the above very quickly for background before we get into the findings. We measure 35 unique sub-competencies underneath each of the CLICK Framework letters. So, if you are setting about trying to estimate your firm’s own enterprise customer intelligence maturity, this is a good cheat sheet as to at least how we think about a robust program or set of capabilities across the firm.
From this introduction, a couple of things are clear from what we have learned versus how the industry typically approaches the issue of metrics correlated to real world outcomes.
1) We focus internally!
The above process is completed with employees of the organization. It matters more how key stakeholders view the organization on these components than external metrics, like NPS, when drawing correlation to impact as we shall soon see.
It makes sense when you think about it. Unless your internal house is in order, then attempts to influence external metrics or experience lasting financial impact will fall short.
2) This is NOT a “one ultimate question” process!
While NPS won the hearts of the Board room because of its simplicity, the world was never that simple. More questions must be answered today to derive how well a company is or could be doing.
Third: Into the Data
To give you a sense what Burshek Research is doing at the highest level. We are benchmarking leading firms across unique industries. This is just a spattering of the enterprises for which we estimate and calculate enterprise customer intelligence maturity scores.
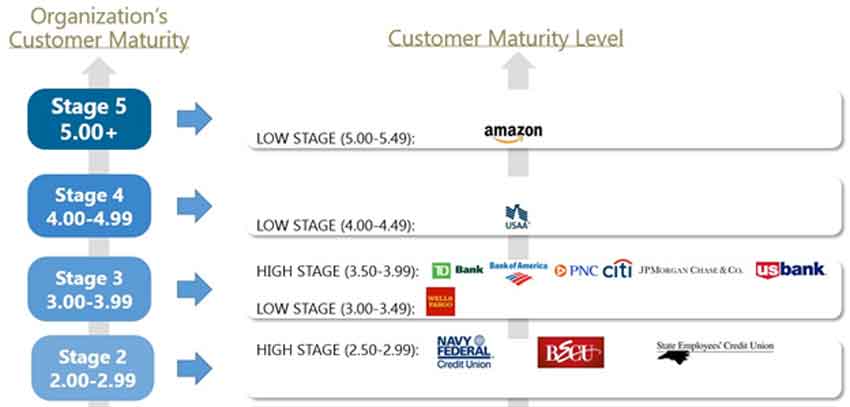
In our last round of interviews, we captured sufficient information from three of the largest credit unions, seven of the largest US Banks and USAA. USAA was included as a barometer for this group due to well recognized customer engagement excellence AND growth. These organizations are:
Scoring these organizations and placing them on the 5 Stages of Customer Intelligence Maturity Framework give us the following:
The industry sector we call the Digital Natives is by far the leading segment we study. Amazon being the highest scoring company of that segment is reflected in the previous output for reference purposes.
With this type of comprehensive view, we see a different picture than that delivered from other credit union industry metrics.
Remember the critical question that needs to be answered: is there a correlation between investment in customer, brand and data analytics and operating and financial performance? Can we show an actual correlation between the two?
We have set out to show that correlation. To do so we compared our Customer Intelligence Maturity scores with financial performance. And what we are finding is a pretty strong correlation.
Of the 72 financial and operating metrics we measure amongst our growing benchmark cohort, 59 have shown some level of positive correlation.
And we did not stop at simply financial performance. We included other interesting performance areas like Most Admired Company, Most Innovative Company, the Fortune and Forbes list, Best Brand lists and more.
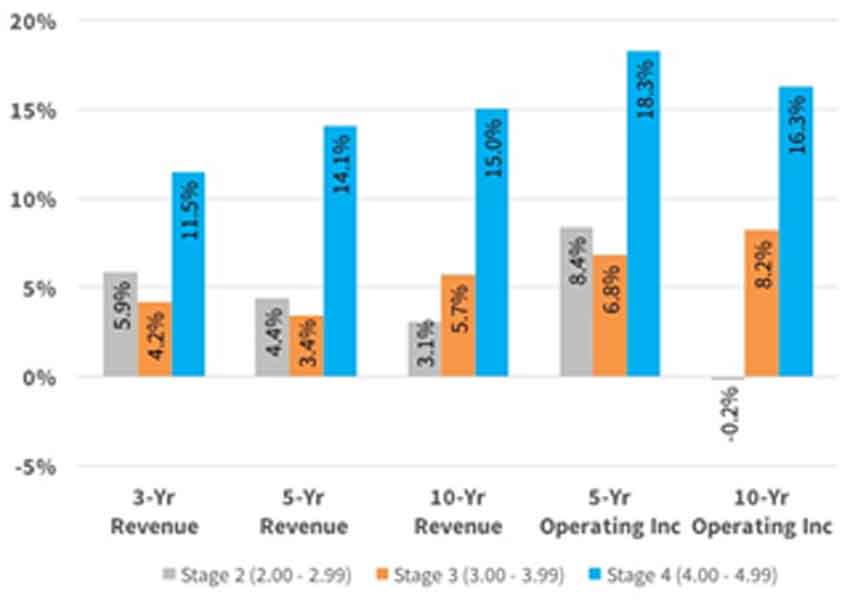
Revenue & Operating Income Growth by Stage
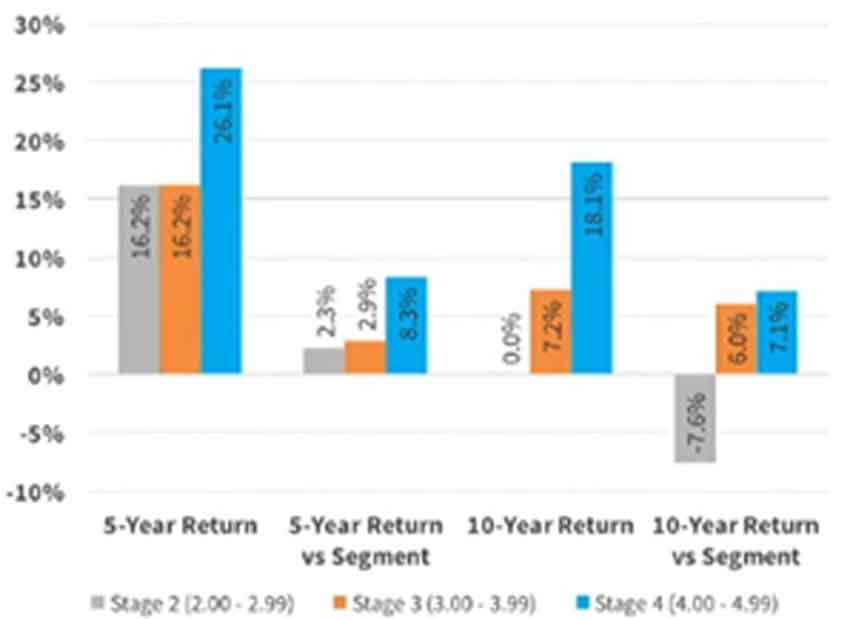
5-Year & 10-Year Investment Return by Stage
We now have a database cohort of over 50 leading companies scored on Customer Intelligence Maturity. When you compare financial performance with investment in customer, brand, and data analytics – the highest performers in customer intelligence greatly out-perform their peer group in terms of financial performance.
In the previous visual, the grey bars are what we call the stage 2 performers. The orange bar is stage 3. The blue bar is stage 4. Look at the dramatic difference in financial and operating performance between the 2s and the 4s. Looking at the impact of great recession (10-year data), shows even more dramatic impact. The data seems to say that as a result of NOT having this customer intelligence focus, stage 2 performers were hit extremely hard when times were very tough.
To summarize the explicit result of the findings: data collection and analysis — at transactional, behavioral, and attitudinal levels — drives meaningful insight and creates real opportunity. These are areas that must be better leveraged by credit unions if they hope to deliver real value and relevance.
Key Takeaways for Action:
1) It takes more than being great in member service to win the day today. You have to be strong in digital and data across all types.
What drives differences in NPS ratings between credit unions and banks is always people. Specifically, employee friendliness, helpfulness and knowledge. No argument there.
However, the change of consumer actions to consult digital first and most frequently has muted this former credit union strength. This change in behavior has helped banks tremendously. They are pouring vast resources into elements that translate to the bottom line quicker and in more varied ways than human capital.
Interesting? Yes. Impossible to do? Not when you have good insights coming from your knowledge structure. This focus from banks is a simple reaction to knowing what drives business and meets customer needs.
Action item:
Credit unions must invest in knowledge structures! These “member engagement platforms” and/or processes provide invaluable insights to drive specific actions.
2) Credit unions continued focus on traditional competitors has led to intelligence myopia.
The gap between the three large credit unions and large banks is significant, both in customer intelligence and real dollars.
What is the strategy large banks employed to gain this advantage?
They early on shifted their competitive focus from traditional competitors to keeping pace with the influence of Digital Natives. A great example of this is USAA’s “saver button.”
Shortly after Amazon introduced the Amazon Dash button, USAA introduced a small button, emblazoned with the USAA logo, that syncs via Bluetooth to your phone. When you press the button, it transfers $1 from your checking account to your savings account. Press the button again, and it moves $2. 3rd time: $3. 4th: $4. Maximum of four presses per day for a total of $10.
They took a common complaint, “I want to save money but don’t know how” and implemented a familiar technological solution for their members.
Action item:
Better identify “low hanging fruit” needs of members and then understand those needs will be met predominantly through technology in the future. Either by you or someone else.
3) Today’s strategy and tactical focus has to be across many areas, not just becoming an expert in one.
Since they have the customer knowledge to start from (#1 above), the highest performing organizations are not expert or world class in only one unique area, they are strong across a number of fronts. They focus across the wide view of customer intelligence. This leads to more meaningful outcomes than simply running a promotion or a slightly updated product introduction.
What else can you do?
Fortunately, customer intelligence and technology options are abundant today. And far more affordable than ever. There are numerous professionals available to assist you. Not just in setting up such insight processes but in implementing the outcome to create impact on strategic and tactical decisions.
You can reorganize your current budget to bring in external partners. Given the breadth of knowledge and expertise typically required, getting into today’s game is not something most credit unions can hire internally. But it is readily available through third parties.
Another option is to recognize jumping into the fray at this level is not something your organization wants to do on its own. Bringing in external professionals may not be amenable to your Board or leadership.
If this is the case, then you can enlarge your capacity to meet member needs and wants through a merger. A merger with a larger credit union to provide more capabilities, or merging of one or more smaller credit unions to do so, are very viable option.
Whatever way you choose to use this new information, you now realize where the largest credit unions stand relative to not just top bank competitors but top digital natives.
And we believe we have provided good discussion fodder to answer the question of: IS there a measurable advantage gained from customer, brand and data analytics?
Guest Author: John Burshek, President, Burshek Research & Consulting, john@burshekresearch.com
At Burshek Research, our expertise is blending technology solutions, proven research acumen and a deep understanding of the marketplace to get you the right information. We help executives obtain uniquely rich and accurate market feedback with which they can present, package, position, price and market brands, products and services for maximum market appeal and adoption.

 CEO Advisory Group
